
Cryptocurrency Price Prediction Using Machine Learning
Leveraging historical data to forecast crypto trends
Introduction
Cryptocurrency markets are known for their high volatility and unpredictability, making price forecasting a challenging yet valuable task. In this project, I explored how machine learning models can be used to predict cryptocurrency prices based on historical data. Using Python, I conducted data cleaning, visualization, statistical analysis, and built a predictive model using LSTM (Long Short-Term Memory networks).
This analysis provides insights into how different cryptocurrencies behave over time and how predictive modeling can help in decision-making for traders and investors.
Objective:
- Analyze historical cryptocurrency price trends.
- Identify patterns and trends using data visualization.
- Build a machine learning model to predict future cryptocurrency prices.
Technologies & Libraries Used:
- Python: pandas, NumPy, scikit-learn, TensorFlow/Keras
- Data Visualization: Matplotlib, Plotly
- Machine Learning Model: LSTM (Long Short-Term Memory)
Data Collection & Preprocessing
The dataset was sourced from Kaggle and contained historical price data for multiple cryptocurrencies, including Bitcoin (BTC), Ethereum (ETH), Binance Coin (BNB), and Nanox (NANOX).
Key preprocessing steps included:
✔ Data Cleaning: Removed missing values and inconsistencies.
✔ Feature Engineering: Created new features such as daily returns, moving averages (SMA20, SMA50), and Bollinger Bands.
✔ Normalization: Scaled data to improve model efficiency
Thought Process Behind Choosing LSTM
When selecting a machine learning model for cryptocurrency price prediction, I considered multiple options, including traditional statistical methods (ARIMA), classical machine learning models (Random Forest, XGBoost), and deep learning architectures. Ultimately, I chose LSTM (Long Short-Term Memory networks) due to the following reasons:
- Time-Series Data Handling: LSTMs are specifically designed to recognize long-term dependencies in sequential data, making them ideal for cryptocurrency price trends.
- Memory Retention: Unlike traditional neural networks, LSTMs use memory cells to retain past information over longer time intervals, which is crucial in understanding historical price patterns.
- Prior Success in Financial Forecasting: LSTMs have been widely used in financial market predictions, demonstrating better performance than traditional regression models in capturing trends and patterns.
However, in hindsight, while LSTM provided some useful insights, it also exhibited overfitting and struggled with generalization, highlighting the need for improvements in future implementations.
Data Visualization & Trend Analysis
To gain insights into market behavior, I visualized the following:
- Cryptocurrency Price Trends Over Time
- Cryptocurrency Price Trends Over Time
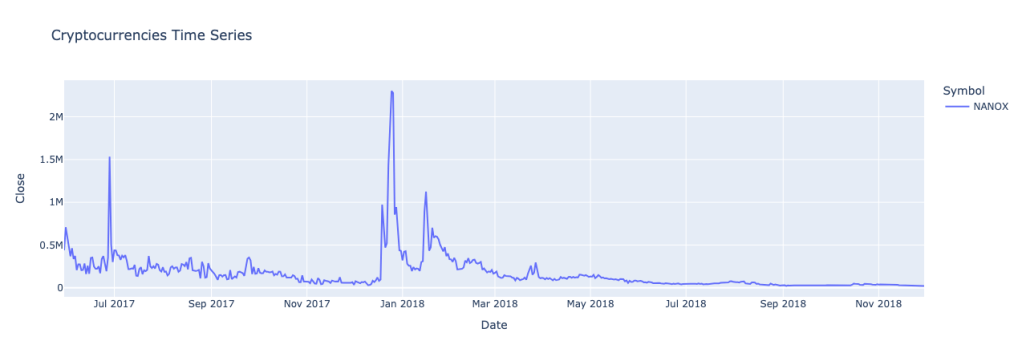
- The price of NANOX exhibited extreme volatility with major spikes, often reaching values far beyond other cryptocurrencies. Due to its large price fluctuations, plotting it together with Bitcoin, Ethereum, and Binance Coin made their trends nearly invisible.
- To provide a clearer picture of overall market movements:
- NANOX was plotted separately to highlight its significant price swings and market behavior.
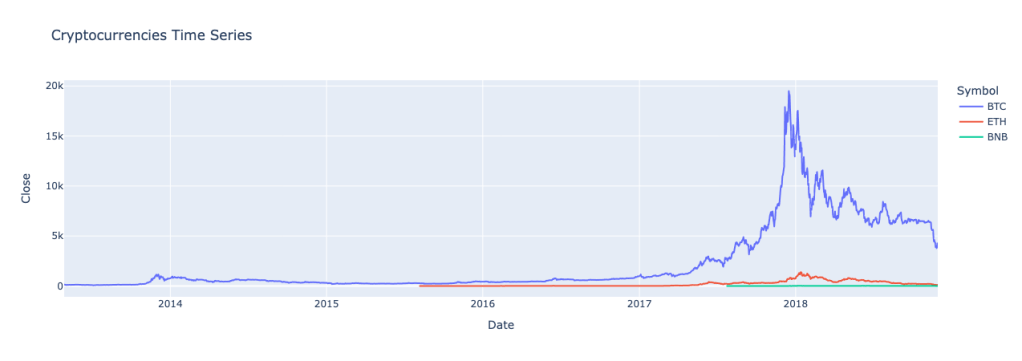
- BTC, ETH, and BNB were grouped in a separate visualization, ensuring their trends and interactions remained visible.
Observations:
- The price of NANOX had extreme volatility from mid-2017 to early 2018.
- There were multiple price spikes, particularly one major peak around early 2018, reaching over 2 million before rapidly declining.
- After the early 2018 peak, the price trend steadily declined and remained low for the rest of the period.
Possible Interpretation:
- The huge price spike suggests a speculative bubble, likely driven by market hype, low liquidity, or manipulation.
- The decline could indicate loss of investor interest, profit-taking, or a crash due to market corrections.
Observations:
- Bitcoin (BTC) dominates the graph, showing a massive price increase up to $20,000 in late 2017 before experiencing a sharp decline.
- Ethereum (ETH) and Binance Coin (BNB) had a similar but much smaller-scale pattern, reflecting the general crypto market cycle.
- The entire market followed a boom and bust cycle, peaking in late 2017 – early 2018 and then declining.
Possible Interpretation:
- This pattern aligns with the 2017 cryptocurrency bull run, where Bitcoin and altcoins saw massive gains due to speculation, ICOs, and mainstream media hype.
- The crash after 2018 aligns with the “crypto winter”, where regulations, market corrections, and loss of hype led to price declines.
- The relatively small movements of ETH and BNB suggest that BTC was the main driver of the crypto market’s overall trend
2. Daily Returns & Volatility Analysis
- BTC and ETH showed relatively stable volatility, while BNB and NANOX exhibited more erratic fluctuations due to their shorter trading history.
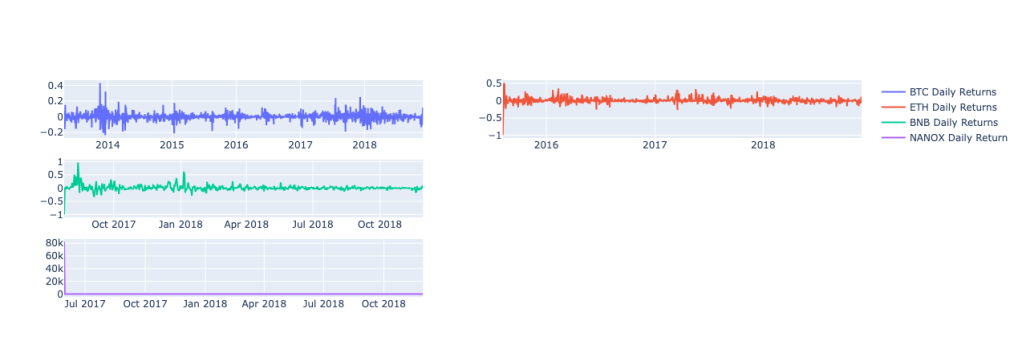
- Higher volatility = Higher risk: Cryptos like ETH and NANOX show significant swings, making them more speculative and risky.
- BTC remains relatively stable: Even though BTC has some sharp spikes, it is less volatile than ETH and NANOX.
- BNB is the most stable: It has the lowest return fluctuations, meaning it might be less speculative compared to the others. Extreme spikes signal market events: Big spikes in daily returns could be caused by news events, exchange listings, or market crashes.
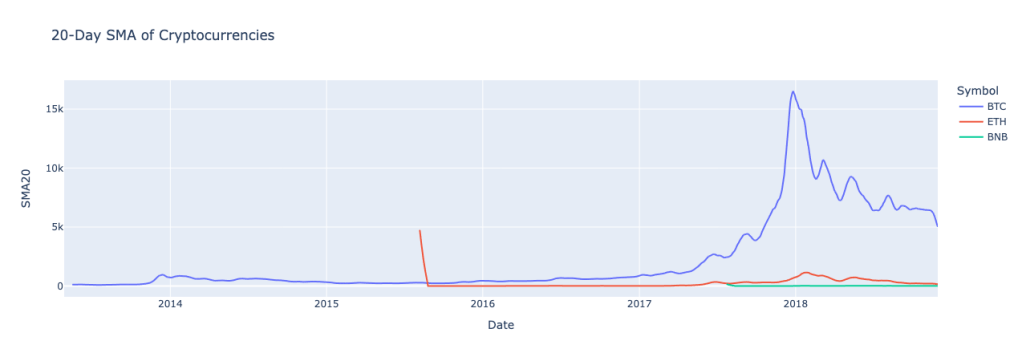
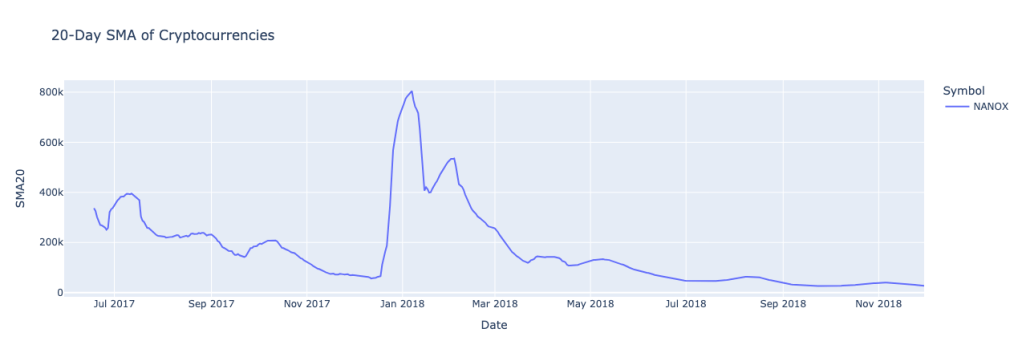
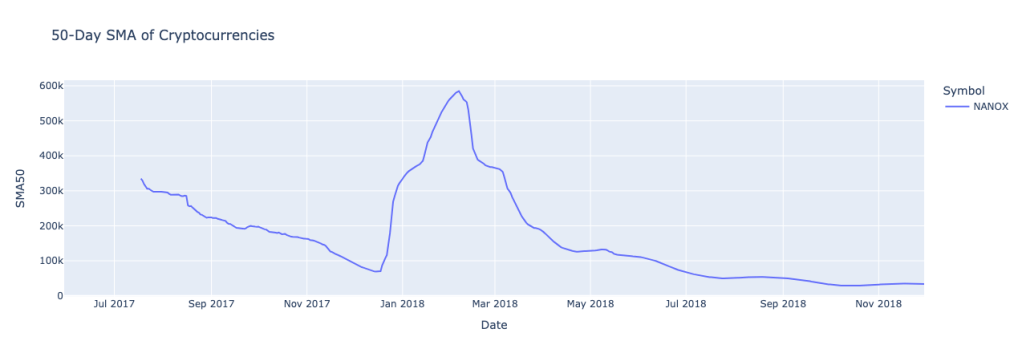
3. Moving Averages & Bollinger Bands
- SMA (Simple Moving Averages) helped identify long-term trends.
- Interpretation:
- The sharp spike followed by a rapid decline suggests high speculation, possible price manipulation, or a pump-and-dump cycle.
- The higher values for the shorter SMA (20-day) show how quickly the price changed, while the 50-day SMA smooths out volatility.
- The prolonged low price movement after the crash indicates that NANOX likely lost investor interest.
- BTC, ETH, and BNB followed the 2017-2018 crypto bull cycle, with BTC leading the market trends.
- The smoother 50-day SMA confirms that long-term trends are more reliable than short-term price fluctuations.
- BTC had a stronger recovery compared to NANOX, showing that it retained market confidence.

Building the Prediction Model
To predict future cryptocurrency prices, I implemented an LSTM-based neural network.
Model Training Process:
✔ Feature Selection: Used closing price as the target variable.
✔ Sequence Data Creation: Trained the model using past 60-day price data to predict the next day’s price.
✔ Splitting Data:
- 70% Training Data
- 15% Validation Data
- 15% Test Data
✔ Model Architecture:
- LSTM layers to learn sequential price patterns.
- Dense output layer to predict future prices.
- Optimizer: Adam
- Loss Function: Mean Squared Error (MSE)
Model Evaluation & Prediction Results
After 50 epochs, the model’s performance was assessed using Root Mean Square Error (RMSE):
- RMSE = 157,293, indicating significant prediction errors, particularly for volatile cryptocurrencies like NANOX.
- The model showed signs of overfitting, as it performed well on training data but struggled with generalization.
Predicted vs. Actual Prices (as of 11/30/2018)
| Cryptocurrency | Actual Price | Predicted Price |
|---|---|---|
| BTC | $4,017.27 | $4,133.837 |
| BNB | $5.08 | $147.300 |
| ETH | $113.17 | $256.721 |
| NANOX | $15,838.15 | $22441.572 (outlier) |
While BTC and ETH predictions were relatively close, BNB and NANOX had larger deviations, suggesting limitations in the model’s ability to capture short-term volatility.
Areas for Improvement
The model’s performance, particularly for BNB and NANOX, reveals significant deviations in predicted prices, indicating areas that require further optimization. Below are key areas for improvement:
1. Handling Extreme Volatility & Outliers
- Issue: The model severely overestimated NANOX and BNB, suggesting difficulty in handling extreme price fluctuations.
- Solution: Implement outlier detection and removal techniques, such as Z-score filtering or IQR-based filtering, before feeding data into the model.
- Additionally, consider normalizing prices using log transformations to prevent large-scale variations from dominating training.
2. Enhancing Feature Selection
- Issue: The model relied primarily on closing prices, missing other important market signals.
- Solution: Introduce additional features such as:
- Trading Volume: Helps account for liquidity trends.
- Market Sentiment Analysis: Using news sentiment or social media data to gauge investor behavior.
- Technical Indicators: Include RSI (Relative Strength Index), MACD (Moving Average Convergence Divergence), and Bollinger Bands to provide a more holistic view.
3. Improving Model Generalization & Reducing Overfitting
- Issue: The model performed well on the training data but struggled to generalize, indicating overfitting.
- Solution:
- Apply Dropout Regularization within LSTM layers to prevent overfitting.
- Implement Early Stopping to halt training when validation loss stops improving.
- Test alternative sequence lengths (30-day vs. 60-day time windows) to find an optimal balance.
4. Alternative Model Architectures
- Issue: LSTMs work well with sequential data but struggle with short-term volatility and sharp trend reversals.
- Solution: Compare the performance of LSTM with:
- Transformer-based models (e.g., Time Series Transformer) for better long-term pattern recognition.
- Hybrid models (LSTM + XGBoost or ARIMA) to combine deep learning with traditional forecasting techniques.
5. More Robust Evaluation Metrics
- Issue: The model was evaluated using RMSE, which is sensitive to large errors, leading to inflated error values due to extreme outliers.
- Solution: Complement RMSE with additional evaluation metrics:
- Mean Absolute Percentage Error (MAPE): Helps assess percentage-based errors.
- Directional Accuracy: Measures how often the model correctly predicts upward or downward trends rather than absolute price values.
Conclusion
This project demonstrates how machine learning and time series analysis can be applied to financial markets, particularly cryptocurrency forecasting. While the LSTM model provided some insights into price trends, its overfitting issues and high RMSE indicate a need for further improvements.
📌 Want to explore the full code? [https://github.com/hanphamhong/price-prediction-using-machine-learning]

Leave a comment